Why Infographics Are Essential to Marketing Research
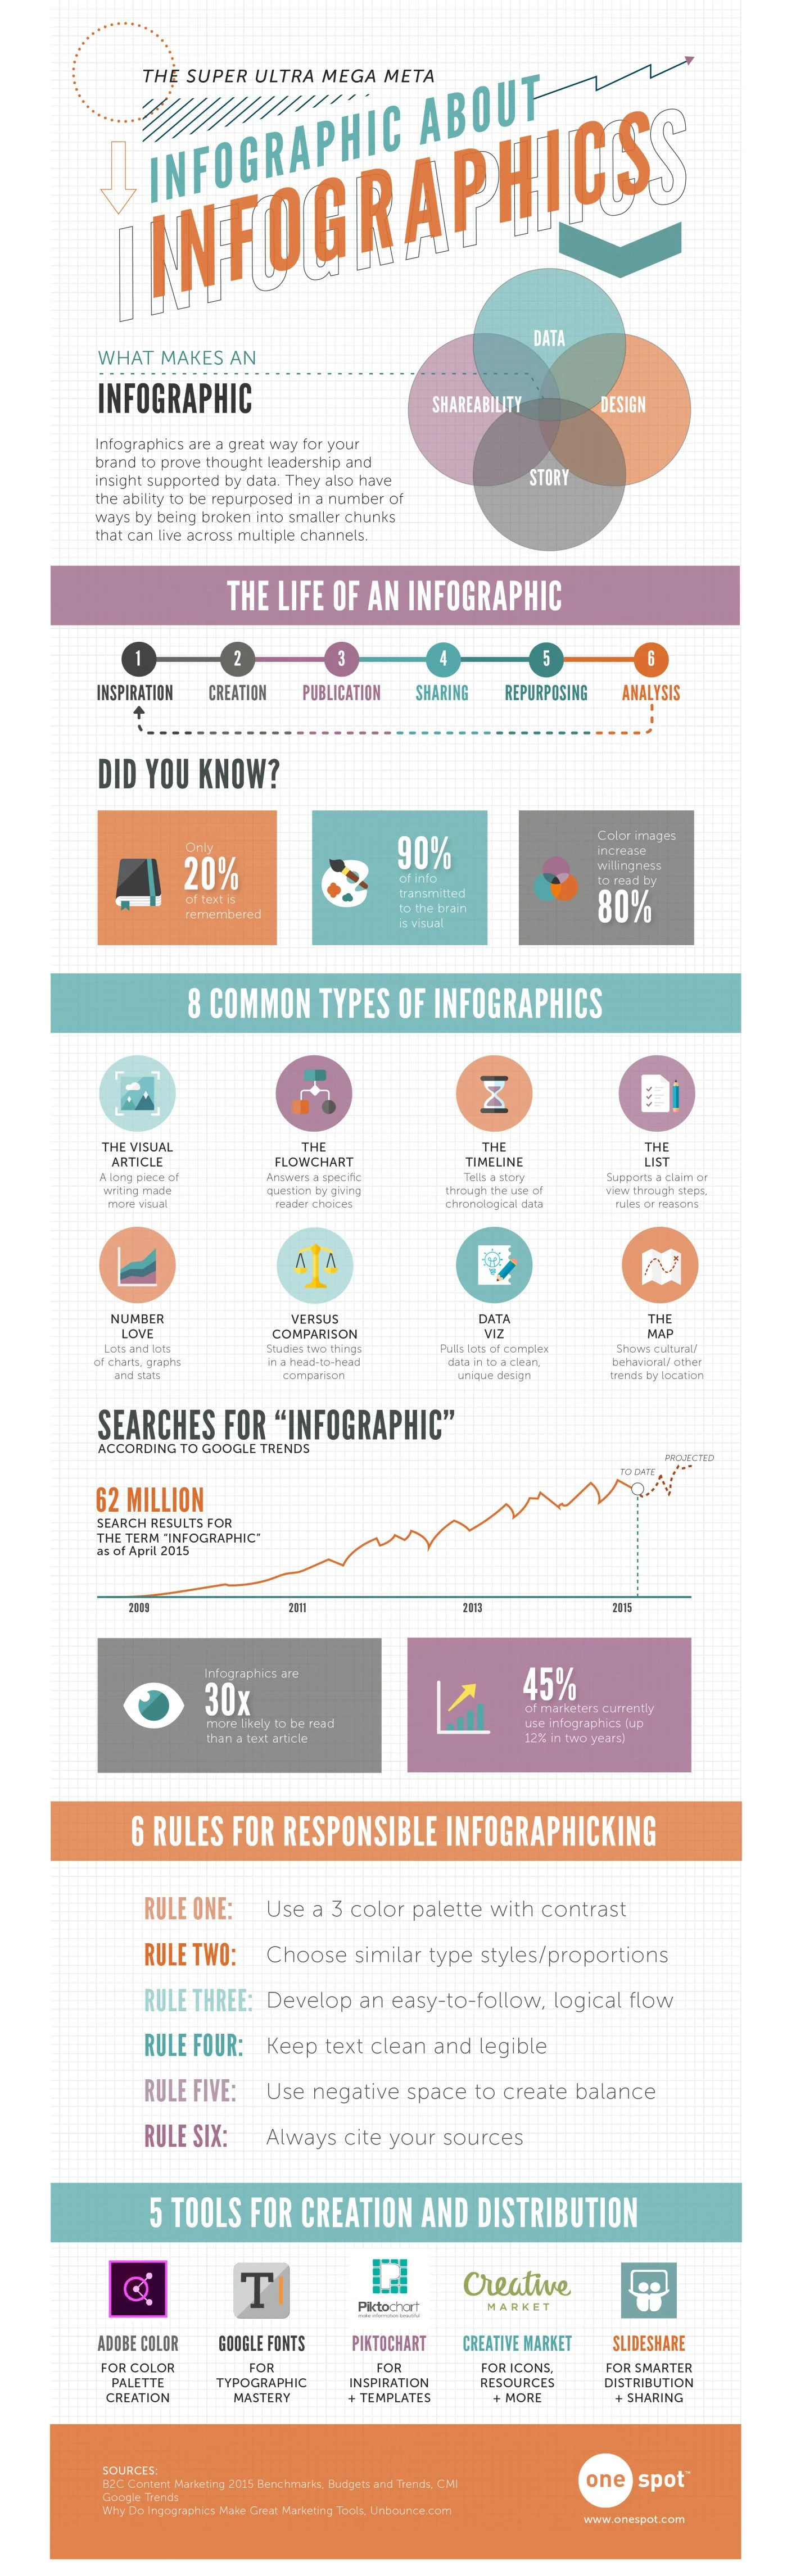
What better way to argue the undeniable value of an infographic than with an infographic?
A staple in W5’s Strategy Practice toolbox, data visualization techniques have become increasing important in delivering research findings in a way that creates “stickiness.” Distilling a 100+ page report into one clear, concise, visually-engaging story is no easy task. This requires not only the skills of a seasoned researcher to determine what information to include, but also requires an eye for design.

Our clients see the value in W5’s smartly designed infographics as well. W5 hears comments like “our internal clients really enjoyed the infographic and appreciated having a ‘takeaway’” and “we’ve received great PR coverage on the study results thanks to the infographic deliverable.” Working with a research partner that can deliver an actionable Final Report complemented by an infographic can significantly extend the shelf life of a research study, and in turn, stretch your research dollars.
Still skeptical of the power of infographics? Thanks to the team at OneSpot, here is an infographic highlighting some key stats and best practices on the topic.